The Foodwatch 2013 Website Survey - THE RESULTS

Recently we ran a website survey and we thought you’d like to see the results. We wanted to know why you come to Foodwatch, what you’re looking for, what you’re really interested in, as well as a bit about you – do you work at paid employment, do you do the cooking or the shopping etc? The results are quite interesting so take a look!
First of all, a bit about you, our readers.
Reader snapshot
 It turns out that 99% of you are female, with 68% of you between the ages of 20 and 55 and 30% of you over 55.
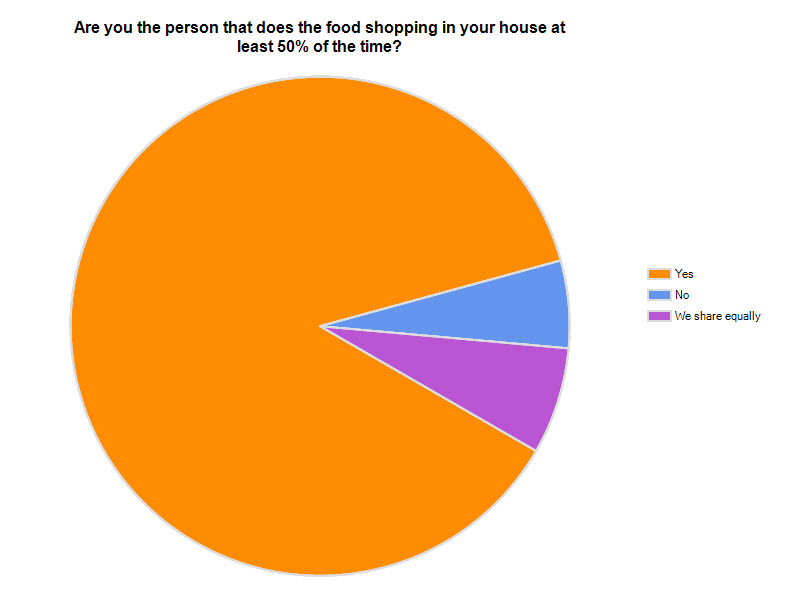
87% of you do the shopping at least half of the time and only 33% of you have children under 18 living at home.
80% cook for more than one person, 70% work in paid employment with 49% of those full time and 51% part time. 39% work in the Nutrition/Food industry.
Special Diets – allergies/intolerances, medical needs, weight loss
30% of you cook for people with allergies and/or intolerances. The main problems seem to be lactose/dairy 49%, gluten/wheat 68% and nuts 16%. Obviously some people are coping with more than one intolerance which always makes cooking tricky.
27% of our respondents cook for people with special dietary needs other than intolerances. The main ones cited were diabetes - 64%, heart disease - 40%, and digestive disorders - 28%. However 64% also cited other special diets as well including Iron, Vitamin D and iodine deficiencies, vegetarian, permanent ileostomy, fibromyalgia, low salt diet, sports nutrition, kidney disease (moderate protein, low salt), thyroid problems, lapband surgery, arthritis, osteoporosis and high cholesterol.
50% of recipients are actively trying to lose weight.
What you’re interested in
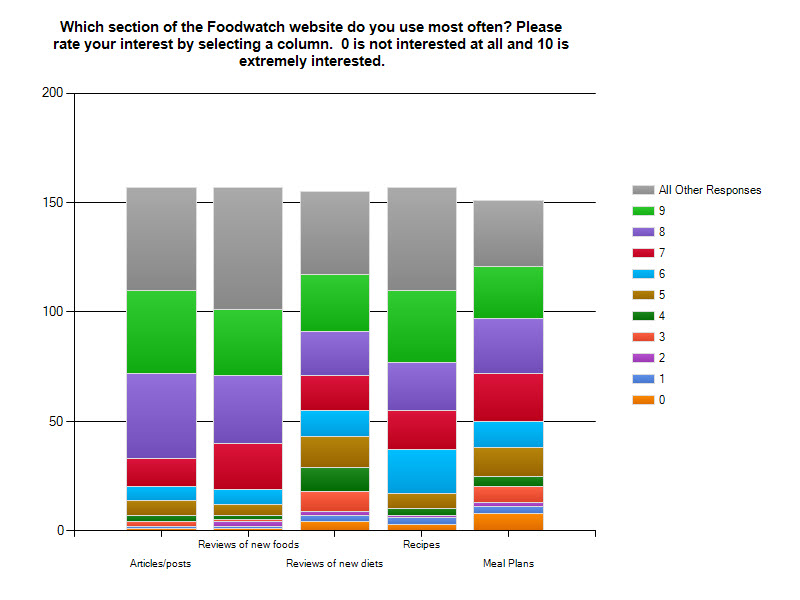
We’ve listed these in the order of their popularity. We've taken the percentage of respondents who rated an item as 7 or more out of 10 in importance
First of all the type of content.
 Articles/posts - 87%
Reviews of new foods - 87%
Recipes -76%
Checklists and tables e.g. how much fibre is in food, how to convert kilojoules to Calories – 75%
Recommended websites or blogs – 69%
Meal Plans – 67%
Reviews of new diets – 65%
Recommended books – 55%
And secondly the subject matter of the content. Again we've taken the percentage of respondents who rated an item as 7 or more out of 10 in importance
Healthy eating general - 96%
Healthy cooking – 91%
Additives, food labels and what's in food – 82%
Women's health problems - 75%
Energy boosting – 75%
Special diets for medical problems e.g. diabetes, gluten-free – 64%
Anti-ageing – 63%
Weight loss – 59%
Feeding kids and family meals – 55%
What’s next?
We’ll try to tailor our content to what you’ve told us you want. Weighting the number of articles and posts to the popularity of the various categories is a bit of a balancing act but we’ll do our best to give you the answers you’re after. Thanks for taking part and for helping us to making Foodwatch relevant to you.


